


World Acrylic Fiber Report
Features
- Asia produced more than 58% of total acrylic production in 2014.
- About 60% of world acrylic fibre production is concentrated in Asia, with 35% in China alone.
- Global acrylic fibre production declined by an average 2% per annum during the last 14 years as demand weakened along the years.
- Acrylic fibre demand in Asia declined 7% in 2014 to 1.07 million tons and accounted to 52% of global demand.
report content
| PREFACE | 5 |
| LIST OF TABLES | 7 |
| FIBRE WORLD 2014 | 9 |
| Global Economy in Low Gear | 9 |
| Fibre Growth Slows Down in 2014 | 9 |
| Supply and Demand in 2014 | 11 |
| World Statistics | 14 |
| ACRYLIC | 21 |
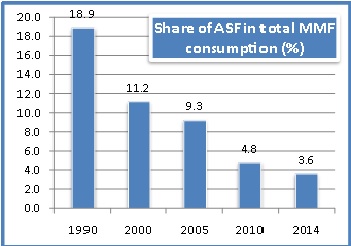
| Acrlyic Fibre losing share | 21 |
| Acrylic in 2014 | 22 |
| Acrylic statistics | 24 |
| ABOUT YARNSANDFIBERS | 52 |
list of tables
| Table 1.1. Growth and Share of Fibres | 9 |
| Table 1.2. Growth of Natural Fibres' Production | 10 |
| Table 1.3. Growth in Manmade Fibre / Filament wise Production | 10 |
| Table 1.4. World Supplies of Fibres and Filaments in Primary Form in 2014 | 13 |
| Table 1.5. Trends in Fibre / Filament Production | 14 |
| Table 1.6. Trends in Fibre / Filament Exports | 14 |
| Table 1.7. Trends in Fibre / Filament Imports | 15 |
| Table 1.8. Trends in Fibre / Filament Apparent Consumption | 15 |
| Table 1.9. Trends in Manmade Fibre / Filament wise Capacity | 16 |
| Table 1.10. Trends in Manmade Fibre / Filament wise Production | 16 |
| Table 1.11. Trends in Manmade Fibre / Filament wise Export | 17 |
| Table 1.12. Trends in Manmade Fibre / Filament wise Import | 17 |
| Table 1.13. Trends in Manmade Fibre / Filament wise Apparent Consumption | 18 |
| Table 1.14. Trends in Natural Fibre wise Production | 18 |
| Table 1.15. Trends in Natural Fibre wise Exports | 19 |
| Table 1.16. Trends in Natural Fibre wise Imports | 19 |
| Table 1.17. Trends in Natural Fibre wise Apparent Consumption | 20 |
| Table 4.1. Major Acrylic Staple Fibre Suppliers and Consumers | 23 |
| Table 4.2. Demand/Supply Global Trends in Acrylic Staple Fibre | 24 |
| Table 4.3. Trends in Acrylic Staple Fibre Capacity By-Region | 24 |
| Table 4.4. Trends in Acrylic Staple Fibre Production By-Region | 25 |
| Table 4.5. Trends in Acrylic Staple Fibre Exports By-Region | 25 |
| Table 4.6. Trends in Acrylic Staple Fibre Imports By-Region | 26 |
| Table 4.7. Trends in Acrylic Staple Fibre Apparent Consumption By-Region | 26 |
| Table 4.8. Demand/Supply Trends in Acrylic Staple Fibre in Africa | 27 |
| Table 4.9. Trends in Acrylic Staple Fibre Capacity in Africa | 27 |
| Table 4.10. Trends in Acrylic Staple Fibre Production in South Africa | 28 |
| Table 4.11. Trends in Acrylic Staple Fibre Export in South Africa | 28 |
| Table 4.12. Trends in Acrylic Staple Fibre Import in South Africa | 29 |
| Table 4.13. Trends in Acrylic Staple Fibre App. Consumption in South Africa | 29 |
| Table 4.14. Demand/Supply Trends in Acrylic Staple Fibre in Asia | 30 |
| Table 4.15. Trends in Acrylic Staple Fibre Capacity in Asia | 30 |
| Table 4.16. Trends in Acrylic Staple Fibre Production in Asia | 31 |
| Table 4.17. Trends in Acrylic Staple Fibre Exports from Asia | 31 |
| Table 4.18. Trends in Acrylic Staple Fibre Import in Asia | 32 |
| Table 4.19. Trends in Acrylic Staple Fibre Apparent Consumption in Asia | 32 |
| Table 4.20. Demand/Supply Trends in Acrylic Staple Fibre in CIS | 33 |
| Table 4.21. Trends in Acrylic Staple Fibre Capacity in CIS | 33 |
| Table 4.22. Trends in Acrylic Staple Fibre Production in CIS | 34 |
| Table 4.23. Trends in Acrylic Staple Fibre Exports from CIS | 34 |
| Table 4.24. Trends in Acrylic Staple Fibre Imports in CIS | 35 |
| Table 4.25. Trends in Acrylic Staple Fibre App. Consumption in CIS | 35 |
| Table 4.26. Demand/Supply Trends in Acrylic Staple Fibre in Central and East Europe | 36 |
| Table 4.27. Trends in Acrylic Staple Fibre Capacity in East and Central Europe | 36 |
| Table 4.28. Trends in Acrylic Staple Fibre Production in East and Central Europe | 37 |
| Table 4.29. Trends in Acrylic Staple Fibre Exports from East and Central Europe | 37 |
| Table 4.30. Trends in Acrylic Staple Fibre Imports in East and Central Europe | 38 |
| Table 4.31. Trends in Acrylic Staple Fibre Apparent Consumption in East and Central Europe | 38 |
| Table 4.32. Demand/Supply Trends in Acrylic Staple Fibre in Middle East | 39 |
| Table 4.33. Trends in Acrylic Staple Fibre Capacity in Middle East | 39 |
| Table 4.34. Trends in Acrylic Staple Fibre Production in Middle East | 40 |
| Table 4.35. Trends in Acrylic Staple Fibre Exports from Middle East | 40 |
| Table 4.36. Trends in Acrylic Staple Fibre Imports in Middle East | 41 |
| Table 4.37. Trends in Acrylic Staple Fibre Apparent Consumption in Middle East | 41 |
| Table 4.38. Demand/Supply Trends in Acrylic Staple Fibre in North America | 42 |
| Table 4.39. Trends in Acrylic Staple Fibre Capacity in N. America | 42 |
| Table 4.40. Trends in Acrylic Staple Fibre Production in N. America | 43 |
| Table 4.41. Trends in Acrylic Staple Fibre Exports from N. America | 43 |
| Table 4.42. Trends in Acrylic Staple Fibre Imports in N. America | 44 |
| Table 4.43. Trends in Acrylic Staple Fibre Apparent Consumption in N. America | 44 |
| Table 4.44. Demand/Supply Trends in Acrylic Staple Fibre in Oceania | 45 |
| Table 4.45. Demand/Supply Trends in Acrylic Staple Fibre in Central and South America | 45 |
| Table 4.46. Trends in Acrylic Staple Fibre Capacity in South America | 46 |
| Table 4.47. Trends in Acrylic Staple Fibre Production in South America | 46 |
| Table 4.48. Trends in Acrylic Staple Fibre Exports from South America | 47 |
| Table 4.49. Trends in Acrylic Staple Fibre Imports in South America | 47 |
| Table 4.50. Trends in Acrylic Staple Fibre Apparent Consumption in South America | 48 |
| Table 4.51. Demand/Supply Trends in Acrylic Staple Fibre in West Europe | 48 |
| Table 4.52. Trends in Acrylic Staple Fibre Capacity in West Europe | 49 |
| Table 4.53. Trends in Acrylic Staple Fibre Production in West Europe | 49 |
| Table 4.54. Trends in Acrylic Staple Fibre Exports from West Europe | 50 |
| Table 4.55. Trends in Acrylic Staple Fibre Imports in West Europe | 50 |
| Table 4.56. Trends in Acrylic Staple Fibre Apparent Consumption in West Europe | 51 |
Reports by industry
Why you should subscribe?
01
Quick and better decision-making
02
Increased competitive advantage
03
Superior strategy and accurate planning
Who Should Buy?
- Producers and buyers of textiles commodities
- Apparel & garment makers and suppliers
- Textile machinery suppliers
- Textile chemical buyers and sellers
- Textile accessories supplier
- Traders and merchandisers in textile value chain
- Government agencies
- Financial institutions
- Professional service providers
- Consultants and advisors

why us?
21
yrs
experience
Fortune 500
Customer Base
100%
dedicated team
55+
Countries Served Worldwide
Market Intelligence
newsletter
Register below to receive our newsletters with latest industry trends and news!
Our Clients