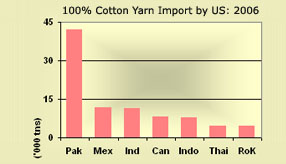
US imported 1 lakh tons of 100% cotton yarn in 2006. This was 13% lower than imports of 2005. Pakistan accounted for 41% of this while India and Mexico 11%. India's exports jumped 181% in 2006, and that of Pakistan was down 2%.
With US $1.65 billion worth of exports, a year-on-year rise of over 30%, the garment and textile sector has gradually relaxed its concern over a possible export
Indian textiles output grew 10% in January 2007. This was led by the 22% increase in cotton textiles. Other textiles production (incl. wearing apparels) was up by a mere 5% while manmade textiles output rose by 13% during January 2007.
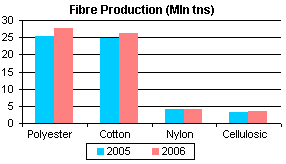
World fibre output has increased 5.1% in 2006 to 74.7 mln tons. This includes 27.7 mln tons of polyester and 26.3 mln tons of cotton increasing by 9% and 7% respectively in 2006. Production of cellulosic fibre and nylon was up 5% and 3% respectively.
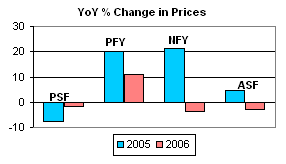
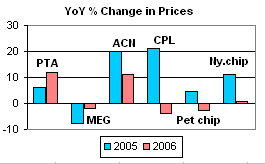
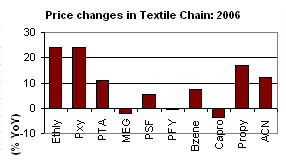
The rise in intermedates prices in 2006 did not weight much on fibre/yarn values. PSF was 2% cheaper over and above 8% fall of 2005. In contrast, PFY prices jumped 11%. Despite ACN price increasing 11%, ASF prices fell 3%. In nylon, the fall in CPL prices was reflected in the 4% drop in NFY prices.
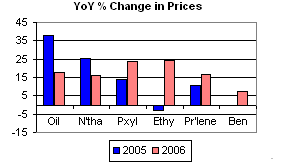
The rise in oil prices decelerated in 2006 to 18% from 38% last year. However, downstream feedstocks prices accelerated on strong support of galloping oil prices. Asian paraxylene and ethylene were dearer by 24% while propylene prices jumped 17%. Benzene was dearer by 8%.
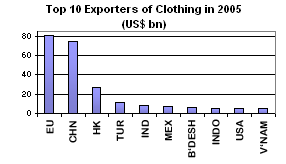
World clothing exports touched US$275 bn in 2005, the first year of quota free trade. This was 6.4% or US$16.5 bn higher than 2004. Major gainers were India and Indoensia . India's rank jumped from 6th in 2004 to 5th in 2005, while Indonesia jumped from 9th to 8th in 2005. USA and Mexico lost thier position by one rank down.
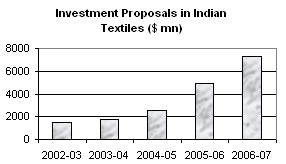
Indian textile industry in the post quota period has expanded from US$37 bn in 2004-05 to US$47 bn in 2005-06. In this period, investment proposals saw an increase 91% and 49% in the respective years. In 2006-07, investments worth US$7.33 bn are underway
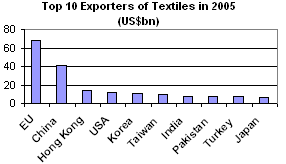
World textiles exports touched US$203 bn in 2005, the first year of quota free trade. This was 3.9% or US$7.5 bn higher than 2004. Major gainers were India and Pakistan. India's rank jumped from 8th in 2004 to 7th in 2005, while Pakistan's jumped from 10th to 8th in 2005. Japan lost its positing from 7th to 10th in 2005.
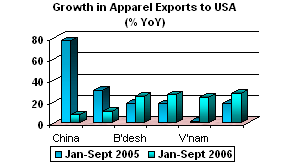
India's textile exports to USA slowed down dramatically to just 9% in 2006. However, China's exports surged 21% although a bit slower but is robust enough. India's unit price realisation too, slid by 4% while that of China increased 9%.
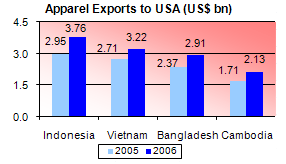
In 2006, apparel export growth rate of Indonesia to USA topped 27.6%, followed by Cambodia with 24.7%. Bangladesh was the third faster exporter clocking a growth of 22.9%. The latest WTO entrant, Vietnam's export surged 18.8%.
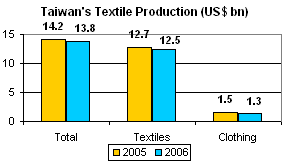
Textiles production in Taiwan declined 2.6% in 2006 US$13.8bn. Production of manmade fibres, yarns and fabrics fell by 1.7% to US$12.5 bn while clothing production declined significantly by 10.5% to US$1.3 bn.
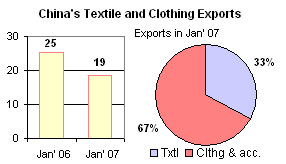
China's textiles, clothing and accessories exports in January grew 18.6% yoy.It was 12.3 percentage points lower than the growth of November, 12.2 percentage points lower than of December and 6.7 percentage points lower than that of last year.
The rise in petrochemical feedstock prices weighed heavily on fibre intermedates values in 2006. Asian PTA was dearer by 12% over and above 6% rise in 2005. Similarly, ACN prices increased 11% on top of 20% in 2005. However, CPL and MEG prices softened on low downstream demand in 2006.
World clothing exports touched US$275 bn in 2005, the first year of quota free trade. This was 6.4% or US$16.5 bn higher than 2004. Major gainers were India and Indoensia . India's rank jumped from 6th in 2004 to 5th in 2005, while Indonesia jumped from 9th to 8th in 2005. USA and Mexico lost thier position by one rank down.
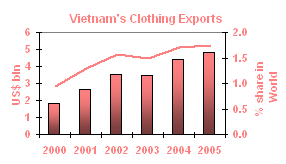
Vietnam became official member last week, making it the 150th country to join WTO. Vietnam's clothing exports saw quantum jump in last 5 years, increasing by 21% per annum. In 2005, it was US$4.8 bln accounting for 1.7% of World's clothing exports.
Crude oil prices jumped 20% in 2006. This adversely impacted the textile value chain through feedstock and fibre intermediates. Prices of feedstock like ethylene, benzene, propylene and paraxylene increased by 20-25% during 2006. This further percolated into the fibre intermediates making PTA and ACN dearer.
The US apparel market is not proving to be a cakewalk for India and China post dismantling of quota in 2005. Although China and India witnessed steep growth in exports in 2005, the momentum tapered away considerably in 2006. They are simply losing out in the fresh wave of competition from smaller players like Bangladesh, Vietnam, Cambodia and Indonesia.
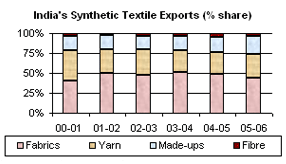
India exported US$2.3 billion worth of synthetic textiles in 2005-06. Of these, 44% were fabrics and 30% yarns. Last 6 years saw dramatic variation in the proportion of fabric and yarn export. Fabric exports were close to 50% between 2001-02 and 2004-05 but declined to 44% in 2005-06
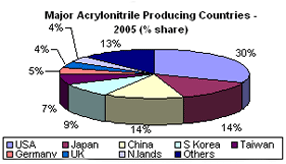
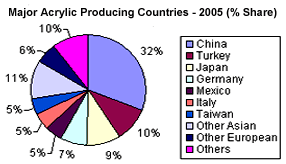
Acrylonitrile is the major raw material for acrylic fibre production. In 2005, the global production of acrylonitrile was close to 5.5 million tons. Asia is a net importer of this raw material while USA, the largest producer, exports 60-80% of its acylonitrile production.
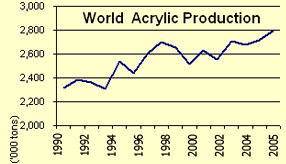
Acrylic accounts for nearly 9% of all chemical fibers produced globally. The share of acrylic in 1980's was about 15% impying a significant decline in its share. Acrylic fibers also displayed the the slowest growth rate of about 1.25% p.a. since 2000, amongst all chemical fibers produced. In 2005, the global acrylic fiber industry was valued at US$5 bn with a production capacity of 3,127 thousand tons.
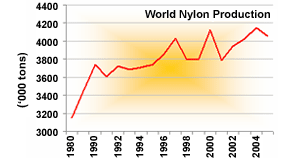
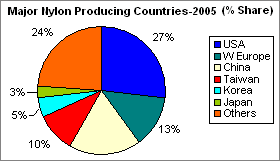
Nylon, accounts for about 12% of all chemical fibers produced globally.The share of nylon has declined considerably from 23% in the 1980s. Currently, the nylon fiber/yarn industry is valued at over US$15 bn, with production being at nearly 4,054 thousand tons.
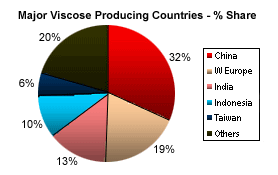
Viscose accounts for 7% of all manmade fibers produced globally. Viscose, a close substitute of cotton, witnessed an increase in production of 9% in 2004. The viscose industry has seen a shift in production base from USA & Japan, (from 20% of the world's viscose in 1990 to only 2% in 2004), to countries such as China, Indonesia and India.
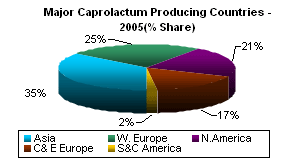
Caprolactum is the chief raw material for Nylon(polyamide)-6 production. In 2005, the worldwide production of caprolactum crossed 4 million tons and was valued at close to US$9 billion. Asia, is a net importer of caprolactum while European countries such as Netherlands, Belgium and CIS countries export significant quantities of caprolactum particularly to Asian consumers.
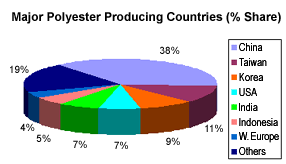
Polyester accounts for 56% of all fibers (natural and chemical) and close to 80% of all chemical fibers. In 2004, its production increased 11%, the highest growth among chemical fibres. China is leading polyester producer with a share of 46% in world's polyester output. USA which in 1990s was producing 18% of polyester, now accounts for less than 5%.
Acrylic accounts for about 9% of all chemical fibers produced in the world. China is the leading producer accounting for 31% of global capacity followed by W. Europe at nearly 18%
USA dominates the nylon world with a share of 27% of total production. West Europe, which in the early 1990's accounted for 18% of total production saw its share decline to 13% in 2005. On the other hand China & Taiwan saw their share rise from 5% in the 1990's to 18% and 10% respectively.
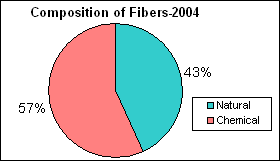
Of
the 62,000 thousand tons of fibers produced
in 2004, 43% constituted natural fibers
and the rest chemical fibers. Polyester
being the major chemical fiber accounts
for 40 % of all fibres while cotton the
major component of natural fibers accounts
for 42% of total fiber.